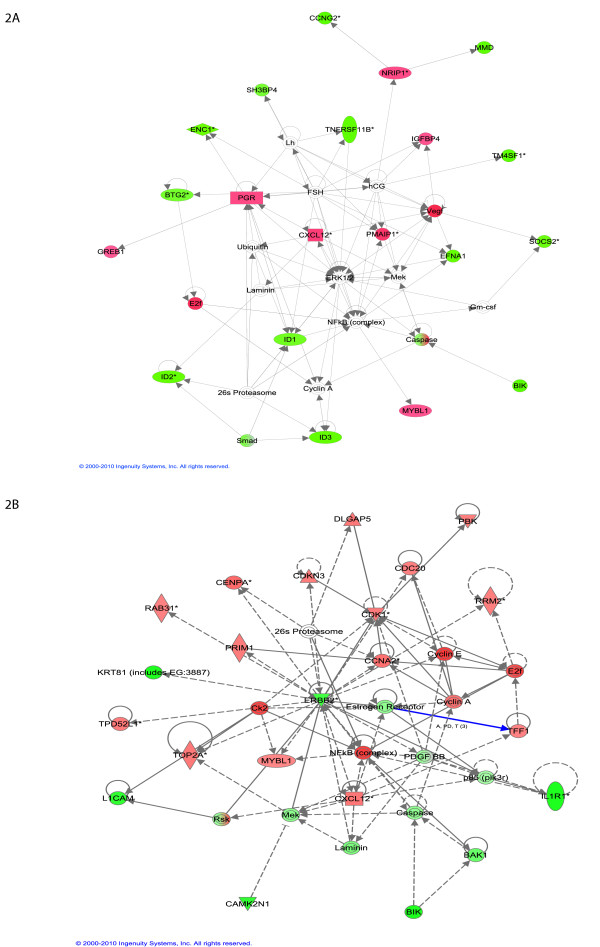
Figure 2.
Highly connected network of top 30 ranked genes at early time point (A). and late time point (B) as identified with IPA. Green node color indicates down regulation and red node color indicates up regulation. White color indicates nodes that are not included in the dataset but were assimilated into network by interaction with other molecules. Direct and indirect interactions between genes are denoted with solid and dashed lines respectively. The style of the arrows indicates specific molecular relationships and the directionality of the interaction (A acts on B). The shapes are indicative or the molecular class (i.e. protein family). Horizontal oval = transcription regulator, vertical diamond = enzyme, and circle = other.

