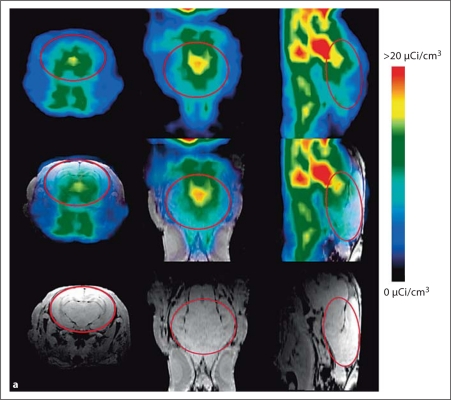
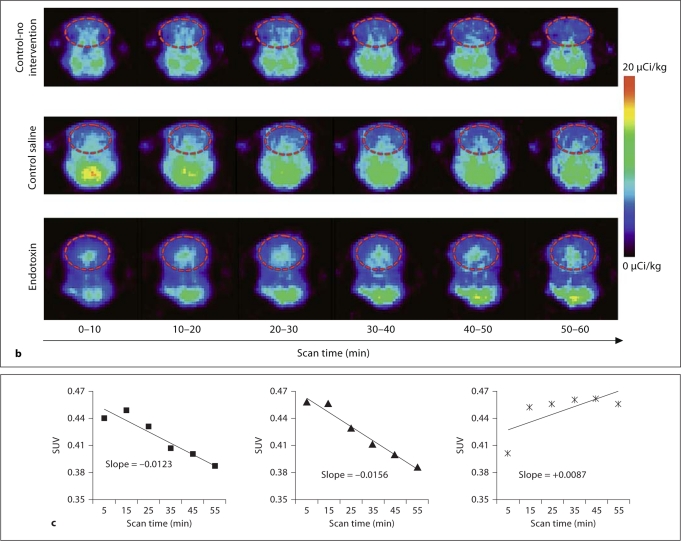
Fig. 1.
a Coregistration of MR and PET images in representative newborn rabbit brain. PET (upper row) and MR images (lower row) along with the coregistered images (middle row) are shown for a representative endotoxin kit. The red solid circle indicates the region of interest (ROI) on the transverse planes (left column), and the red lines on the sagittal planes (right column) indicate the 3D ROI of the brain that was evaluated for [11C]PK11195 uptake, which includes the cerebrum and midbrain. Middle column: Coronal planes. b Representative PET images of [11C]PK11195 uptake over time in newborn rabbit brain. A decrease in [11C]PK11195 uptake in the brain is seen over the time of scanning (60 min) for control-no intervention (upper row) and control saline kits (middle row). In the endotoxin kits (lower row), an increase in tracer uptake is seen over time, indicating specific binding of the tracer to activated microglia in the brain of kits born to dams that were injected endotoxin in utero. The images are binned into 6 frames of 10 min each for analysis. The red dashed circle indicates the ROI involving the whole brain. c Representative slopes of [11C]PK11195 uptake in the brain by PET imaging. The standard uptake value of [11C]PK11195 activity in the brain of the kits in b is shown here. A decrease in [11C]PK11195 uptake, resulting in a negative slope, is noted over the time period of scanning for both control groups, while an increase in uptake demonstrated by a positive slope is noted in the endotoxin kit (right), indicating specific binding of the tracer to activated microglia in the neonatal rabbit brain. Left: Control-no intervention group. Middle: Control saline group.


