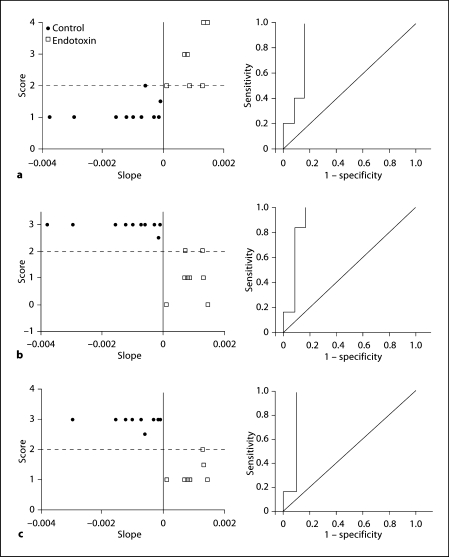
Fig. 2.
Representative neurobehavioral graphs (left) along with the respective ROC curves (right). The neurobehavioral scores for each kit on day 1 were plotted against the uptake slope of [11C]PK11195. Representative graphs (left) and ROC curves (right) for hindlimb tone (a), straight-line motion (b; as a measure of locomotion) and ability to suck and swallow (c; as a measure of feeding). Tone was evaluated from 0 (no increase in tone) to 4 (hypertonic, with limb rigid in flexion or extension), straight-line motion from 0 (worst, unable to move) to 3 (best, has full range of motion, maintains it for at least 3 steps) and ability to suck and swallow from 0 (worst, no jaw movement) to 4 (best, good coordination of sucking and swallowing) based on the scoring system described by Derrick et al. [37] for neonatal rabbit kits. Cutoff values for neurobehavioral scores were drawn at 2, as described in the text (≥2 was considered normal for straight-line motion and sucking and swallowing, and ≤2 was taken as normal for tone). For the PET-derived measure, a positive uptake slope (>0.00) was considered abnormal. There was substantial agreement between uptake slope and hindlimb tone (a, right; κ = 0.65), straight-line motion (b, right; κ = 0.77) and ability to suck and swallow (c, right; κ = 0.87).

