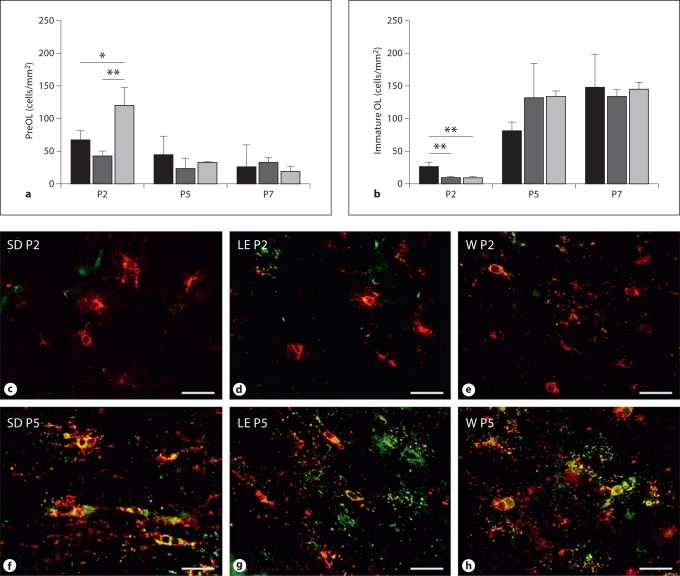
Fig. 2.
Strain-specific differences in the density of preOL (a) and immature OL (b) in SD (black bars), LE (dark gray bars) and W rats (light gray bars) at P2 relative to P5 and P7. * p < 0.05; ** p < 0.01 (ANOVA; post hoc Tukey multiple comparison test). Representative photomicrographs at P2 (c–e) and P5 (f–h) of preOL (red) and immature OL (yellow) in corpus callosum double-labeled with bO4 (red) and O1 (green). Scale bars = 40 μm. c, f SD rat. d, g LE rat. e, h W rat.

