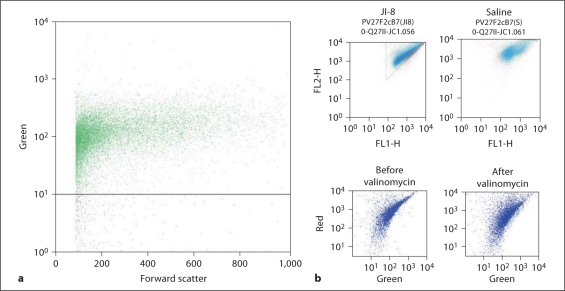
Fig. 3.
Data from a hypoxia slice and representative flow cytometry plots for the 2 mitochondrial membrane-sensitive dyes rhodamine 123 (a) and JC-1 (b). Rhodamine-positive cells were defined as >101 fluorescence units (FU). JC-1 stains red at high concentrations and green at low concentrations. Active uptake by mitochondria concentrates JC-1. Cells were defined as positive if there were >102 red FU and >102 green FU and there were more red FU than green FU (triangle depicts R > G). Two halves from the same brain slice were treated with JI-8 or saline. The upper left panel shows the data from the half-slice treated with JI-8, and the upper right panel shows the other half-slice treated with saline. Note the larger number of cells R > G with JI-8 treatment now seen as a deeper blue color. Valinomycin administration that causes a loss of mitochondrial membrane potential decreases the red fluorescence without affecting green (lower panels).

