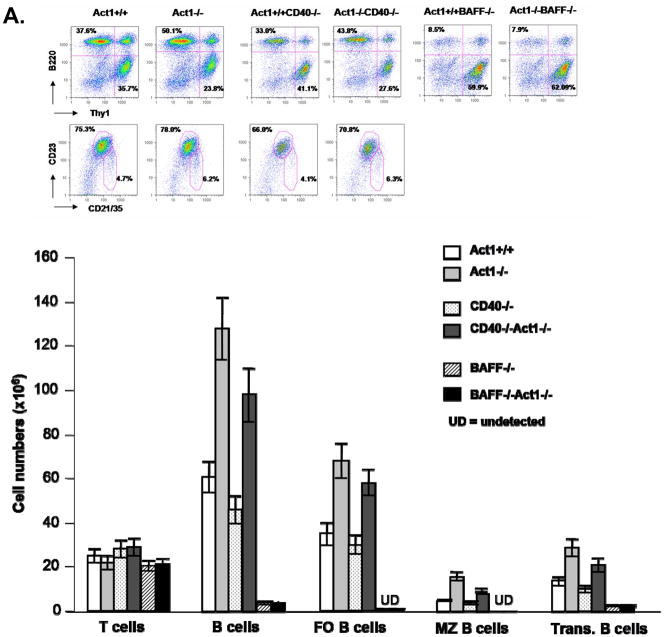
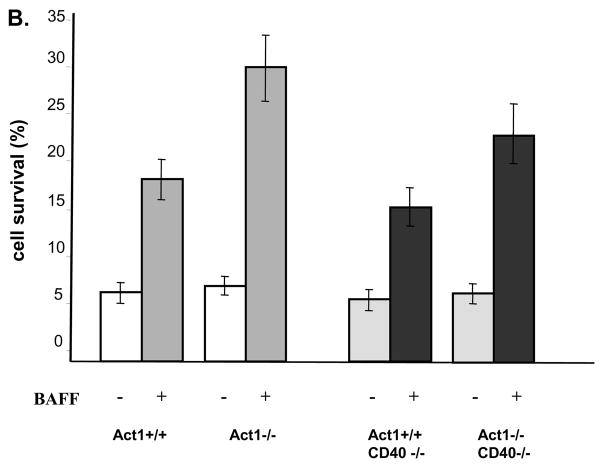
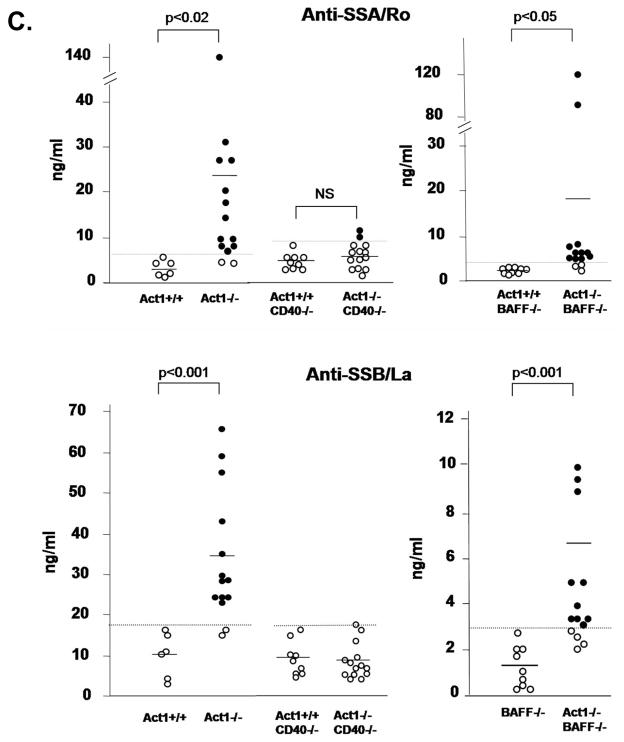
Figure 5. Differential role of CD40- and BAFF-pathways in the development of Sjogren’s phenotype in the Act1-deficient mice.
(A) FACS analysis of splenocytes from three pairs of 8 week old Act1+/+, Act1−/−, CD40−/−, Act1−/−CD40−/−or BAFF−/− and BAFF−/−Act1−/− mice. Upper panel shows a representative staining pattern and the percentage of T cells (Thy.1+), B cells (B220+), follicular (B220+CD21intCD23hi) and marginal zone (B220+CD21hiCD23lo) B-cells. Transitional B cells were defined as (B220+IgMhiIgDlo). Lower panel shows the absolute number of cells for each cell subset. The standard deviation indicates the differences between the individual mice in each group. (B) Enhanced ex vivo BAFF-mediated survival of Act1−/−CD40−/− B cell. Purified splenic B cells from 8-week-old Act1+/+, Act1−/−, CD40−/− and Act1−/−CD40−/− mice were untreated or treated with recombinant BAFF for 4 days. Cell survival was analyzed by FACS as described in the Materials and methods. The data presented are the average of percentage of cell survival for each mice group (n=4). (C) CD40, but not BAFF is required for production of SS-associated autoantibodies. The titer of Anti-SSA/Ro (upper panel) and ant-SSB/La (lower panel) in the serum from 8–10 months old Act1+/+ (n=6), Act1−/− (n=13), Act1+/+CD40−/−(n=9) and Act1−/− CD40−/− (n=14) were measured by ELISA. Short horizontal bars indicate the mean. The significant P values are shown. A grey line is drawn across the graph to show the lowest value in Act1+/+ mice. The values below the grey line are considered positive (black filled dots).


