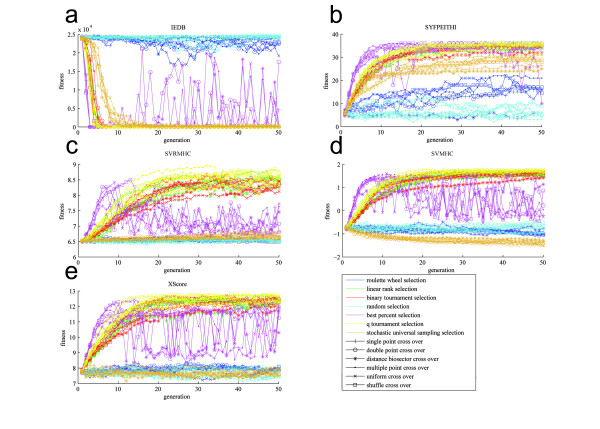
Figure 2.
Median fitness score of the individuals over generations. For each generation we calculate the median of the fitness scores of the 100 individuals per generation. At generation 1 the individuals are random while at generation 50 the individuals should be optimized according to the corresponding scoring function: (a) IEDB, (b) SYFPEITHI, (c) SVRMHC, (d) SVMHC and, (e) XSCORE. For all scoring functions except IEDB the optimum is a maximum (higher values indicate a higher binding affinity, e.g. pIC50-value). In IEDB the optimum is a minimum (lower values indicate a higher binding affinity, e.g. IC50-value). The selection operators are grouped by colour while the recombination operators are grouped by marker symbols. Only the data for the "single point amino acid mutation" is shown.

