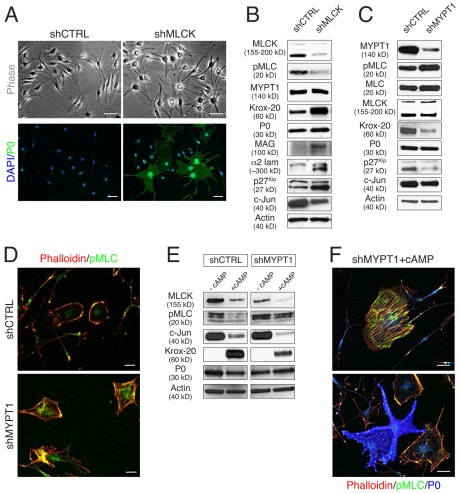
Fig. 3.
Knockdown of MLCK in SCs activates the myelination program. (A) Primary cultures of rat SCs were infected with lentiviral constructs expressing non-targeting shRNA (shCTRL) or shRNA against MLCK (shMLCK). Upper panels: phase-contrast images showing striking morphological differences between these cultures. Lower panels: a dramatic upregulation of P0 expression (green) was observed in SC cultures treated with shMLCK compared with controls (shCTRL). Scale bars: 25 μm. (B) Western blots of SC cultures showing reduction of MLCK and MLC-P (pMLC) levels as well as activation of myelination program in SCs treated with shMLCK compared with shCTRL. (C) Western blots of SC cultures infected with non-targeting shRNA (shCTRL) or shRNA against myosin phosphatase 1 (shMYPT1). Increased levels of MLC-P are seen in shMYPT1-treated SCs, confirming knockdown of the phosphatase. No changes in P0 levels are observed whereas levels of Krox-20, c-Jun and p27Kip are decreased compared with control cultures. (D) SCs cultures showing increased level of MLC-P (green) and robust stress fiber formation in cultures treated with shMYPT1 compared with controls (shCTRL). Scale bars: 25 μm. (E) Western blots of control- and shMLCK-treated SC cultures before (−) and after (+) stimulation with 1 mM db-cAMP for 24 hours. In MYPT1-knockdown cultures, MLC-P levels remain high, although downregulation of MLCK and c-Jun and upregulation of Oct-6 after cAMP treatment appear unaffected; upregulation of Krox-20 was reduced compared with control cultures. (F) Immunofluorescence of SCs after 24 hours of 1 mM db-cAMP stimulation, showing a reverse correlation between the expression of P0 and the presence of high levels of MLC-P. Cells with high levels of MLC-P exhibit abundant stress fibers and lack P0 expression (upper panel); whereas cells expressing high levels of P0 lack stress fibers and have reduced expression of MLC-P (lower panel). Scale bars: 20 μm.

