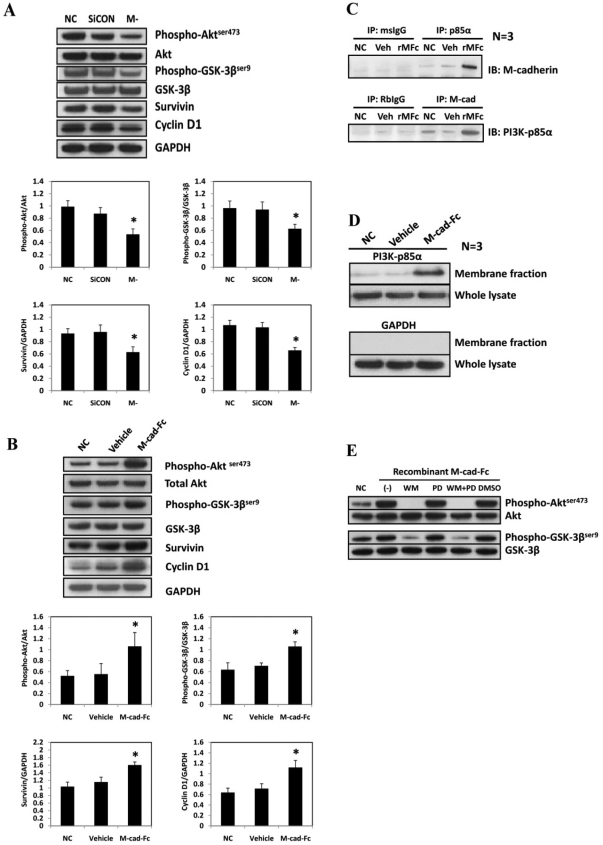
Fig. 3.
M-cadherin-mediated signaling effect on the PI3K/Akt/GSK-3β pathway. (A) Representative immunoblots of M-cadherin-RNAi (M-) treated, non-targeted scrambled siRNA-transfected (SiCON) treated or normal control (NC) C2C12 cells (top). Survivin and cyclin D1 were measured as a functional read-out for GSK-3β activation. GAPDH was used as a loading control. Densitometric analyses of Akt, GSK-3β, survivin and cyclin D1 normalized to their loading controls (bottom). (B) C2C12 myoblasts were grown in normal control (NC), vehicle control (Vehicle) or recombinant M-cadherin–Fc-coated (M-cad–Fc) dishes for 48 hours (top). The cells were lysed and subjected to immunoblotting analysis of the same proteins as measured in Fig. 3A. Densitometric analyses of immunoblot band intensities of phosphorylated and total Akt and GSK-3β, as well as survivin and cyclin D1 in response to recombinant M-cadherin–Fc treatment (bottom). The band intensities of the above proteins were normalized by corresponding control proteins. (C) Immunoprecipitation assays of untreated C2C12 myoblasts (NC) or myoblasts treated with either the vehicle (Veh) or with recombinant M-cadherin–Fc (rMFc) were conducted 48 hours after incubation with either mouse anti-PI3K-p85α or rabbit anti-M-cadherin antibodies, respectively. Western blots of the protein abundance of M-cadherin or PI3K-p85α were conducted in the precipitated proteins. (D) Cell membrane fractions were prepared from cells that had been treated as described in C and blotted to detect the protein abundance of PI3K-p85α. (E) C2C12 myoblasts were treated as described in C. The cells were then treated for a subsequent 12 hours with no vehicle added (-), wortmannin (WM, 200nM), PD98059 (PD, 50 μM), wormannin plus PD98059 (WM+PD) or DMSO. Untreated normal control cells (NC) did not receive either the recombinant M-cadherin–Fc or the vehicle treatments. The cells were harvested for immunoblotting analysis. The data are shown as the mean ± s.e.m. of three independent experiments. *P<0.05 vs the control groups.

