Fig. 1.
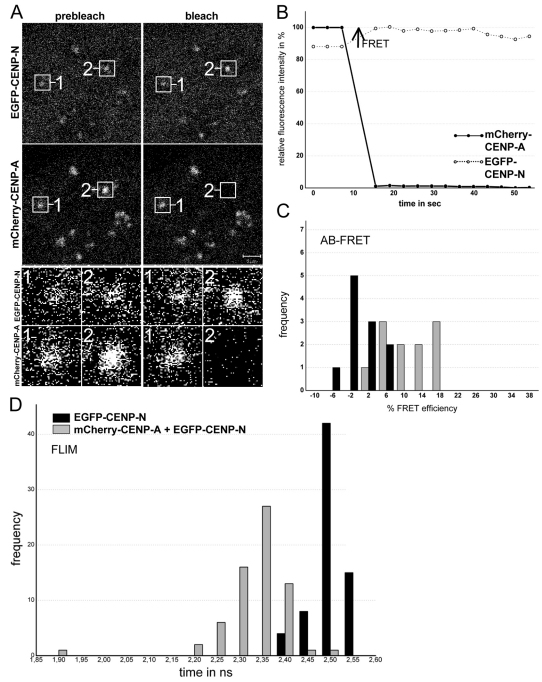
FRET analysis. (A) AB-FRET of the protein pair EGFP–CENP-N and mCherry–CENP-A. Human HEp-2 cells were co-transfected with both fusion proteins. Typical cell nucleus, showing colocalisation at specific (centromeric) locations. Two of these locations, 1 and 2, were selected for fluorescence intensity analysis before and after acceptor bleaching (see enlargement below). Spot 1 served as control and showed no detectable intensity change. At spot 2, the acceptor fluorophore mCherry was bleached (compare prebleach and postbleach images). (B) Time course of the fluorescence intensity of the donor and the acceptor. The acceptor intensities in the ROI (region of interest; black circles) were averaged and normalized to the mean intensity measured at the three time points before bleaching. The donor intensities in the ROI were averaged and normalized to the intensity measured at the first time point after bleaching. Bleaching of the acceptor resulted in a fluorescence intensity increase of the donor (open circles) indicating the presence of FRET (see arrow). (C) Donor fluorescence intensity variation observed during acceptor bleaching was normalized to the intensity measured at the first time point after bleaching to give FRET efficiency (E). For spot 1 (acceptor not bleached, control, 11 kinetochores), this yielded Evar (black bars) and for spot 2 (acceptor bleached, 10 kinetochores) EFRET (grey bars). Frequency values are the number of observed single cases (grouped into Evar or EFRET value ranges of 4%) and are plotted against the values of Evar or EFRET. Only some EFRET values coincided with the distribution of Evar values, however, most EFRET values exceeded the Evar values, indicating the presence of FRET. (D) Histogram of the donor fluorescence lifetimes obtained in FLIM experiments. HEp-2 cells were transfected with EGFP–CENP-N alone (donor only, black bars, control, 69 kinetochores) or co-transfected with EGFP–CENP-N and mCherry–CENP-A. In these living cells, the donor fluorescence lifetimes were measured by TCSPC. The histograms display the fitted lifetime values of all single kinetochores. The heights of the bars represent the numbers of kinetochores (frequency) whose lifetimes fall within the indicated 0.3 nanosecond range (time). When the acceptor is present (grey bars, 64 kinetochores), the donor fluorescent lifetimes were shorter than the control values for donor only (black bars), clearly indicating the presence of FRET. The weak binding to kinetochores of the CENP-NΔC mutant lacking the CENP-N C-terminus (Carroll et al., 2009) resulted in low fluorescence intensities and did not allow for FRET measurements.

