Fig. 2.
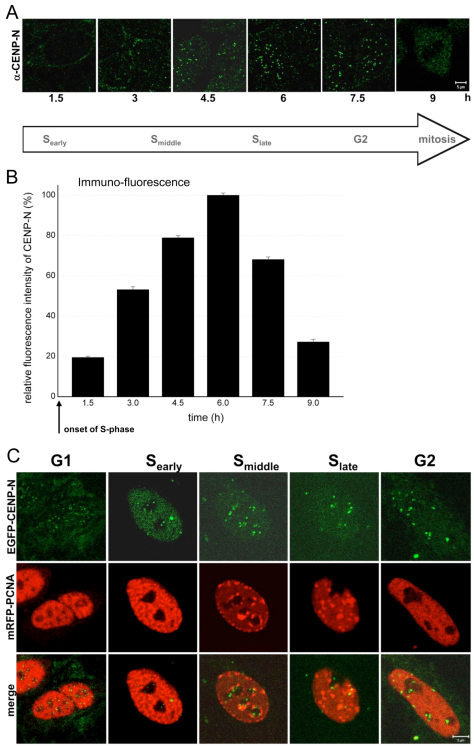
Amount of endogenous immunostained and EGFP-labelled CENP-N at kinetochores in early, middle and late S phase, G2 and mitosis. (A) CENP-N labelled by an anti-CENP-N primary and a fluorescently labelled secondary antibody in HEp-2 nuclei fixed 1.5, 3.0, 4.5, 6.0, 7.5 and 9.0 hours after double-thymidine block release. The amount of antibody-marked endogenous CENP-N at kinetochores increased during S phase and was low in mitosis. Scale bar: 5 μm. A G1 image is not included due to the low CENP-N levels in G1. (B) For each kinetochore, the fluorescence intensity per area was determined and compared. The mean secondary antibody fluorescence intensity per area of 70–250 kinetochores per time point (10–20 kinetochores per cell) was determined at kinetochores within cells at different time points after double-thymidine block release. The fluorescence intensity values are plotted relative to the value at 6.0 hours (100%). Endogenous CENP-N at kinetochores increased during S phase and was depleted from kinetochores during G2. (C) Analysis of EGFP–CENP-N at kinetochores. Detection of EGFP–CENP-N (upper row), mRFP-PCNA as replication marker (middle row) and merge (lower row) in HEp-2 cell nuclei. The fluorescence intensity of EGFP-labelled CENP-N increased from G1 into S phase. Scale bar: 5 μm.

