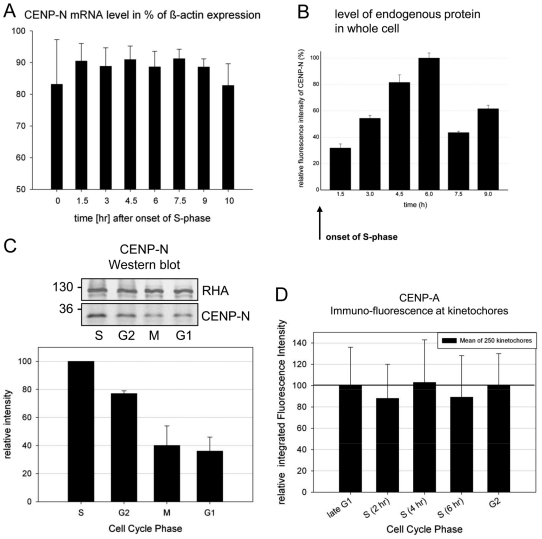
Fig. 3.
CENPN mRNA and whole cell protein levels. (A) mRNA levels (mean of three independent experiments) of CENPN are plotted relative to the value of β-actin in the cells. Human HEp-2 cells were synchronised by a double-thymidine block and analysed after release in time intervals of 90 minutes for 11 hours. (B) After immunostaining of endogenous CENP-N, the whole cell fluorescence was measured and integrated at 1.5, 3.0, 4.5, 6.0, 7.5 and 9.0 hours after double-thymine block release. Whole cell fluorescence intensity values are plotted relative to the maximal value at 6.0 hours (100%). Although the mRNA levels were rather constant, the amount of CENP-N in the cell increased in S phase (with a maximum in late S phase) and decreased afterwards. (C) Western blot analysis of whole cell CENP-N protein levels at 3 (S phase), 7 (G2), 9 (M phase) and 12 (G1) hours after double-thymidine block release relative to the house-keeping gene product RHA. CENP-N was identified by a CENP-N-specific antibody (molecular weight marker values are shown on the left). CENP-N amounts were quantified by the ODYSSEY Infrared Imaging System and are shown in the histogram below. CENP-N levels were maximal in S phase and low in mitosis and G1. (D) CENP-A was antibody stained at 0 (G1–S), 2 (S), 4 (S), 6 (S) and 8 (G2) hours after HEp-2 cells double-thymidine block release and its amounts quantified by integrating the secondary antibody fluorescence intensity at kinetochores. CENP-A levels at centromeres remained constant during S phase and G2. Error bars indicate s.d.

