Fig. 4.
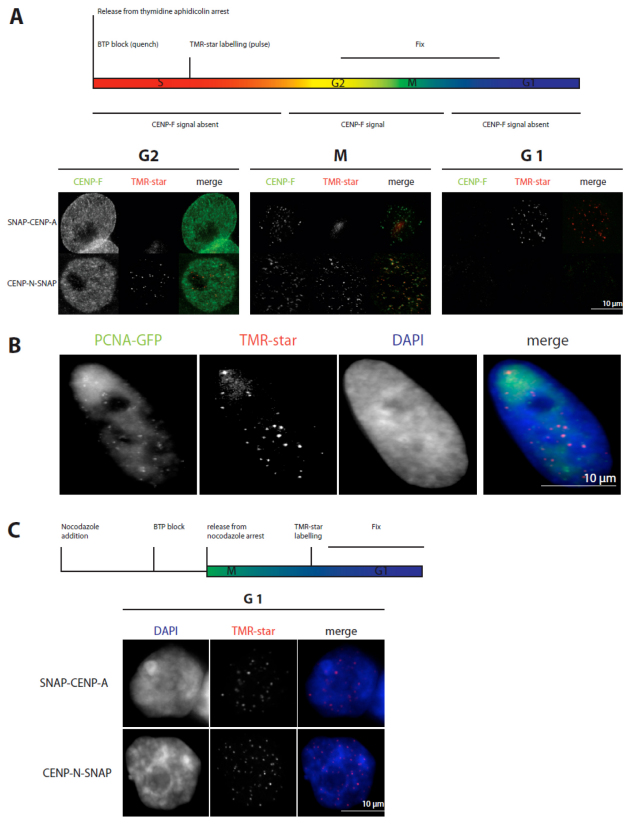
CENP-N loading to kinetochores measured by the SNAP-tag technology. (A) Above: Scheme of the performed experiment. Below: Representative images of cells showing TMR-star fluorescence for SNAP–CENP-A only in G1 and for CENP-N–SNAP in G2 and M phase. Cell cycle phases G2 (CENP-F staining of the whole nucleus) and mitosis (specific kinetochore binding of CENP-F) are clearly identified. (B) The same experiment as in A was performed with U2OS cells stably expressing PCNA–GFP. CENP-N–SNAP fluorescence appeared at kinetochores in late S phase as judged from cellular PCNA distributions. (C) Top: Scheme of the performed experiment. Below: Representative images of cells expressing SNAP–CENP-A and CENP-N–SNAP showing fluorescence at kinetochores during G1. CENP-N was loaded to kinetochores in G1 and S phase.

