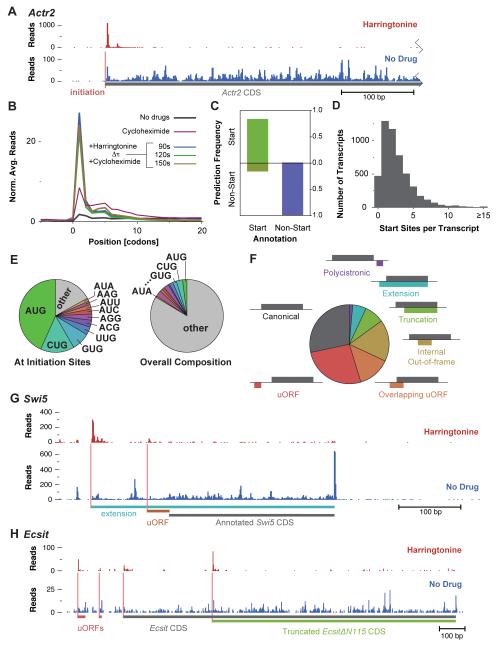
Figure 4.
Harringtonine Enables Automated Identification of Translation Initiation Sites.
(A) Effect of harringtonine on ribosome density for a typical gene. Ribosome footprint read count is shown prior to and following harringtonine treatment (150 s) along the 5′ UTR and the beginning of the coding sequence of Actr2.
(B) Metagene analysis of ribosome footprints surrounding start codons after harringtonine treatment. As in Figure 3B, focusing specifically on the site of translation initiation and the surrounding codons.
(C) Evaluation of start site prediction analysis. Plotted is the fraction of positive and negative initiation site predictions for start and selected non-start codons that were excluded from the training set.
(D) Histogram of initiation sites predicted per transcript.
(E) Distribution of AUG codons and near-AUG codons at predicted sites of translation initiation (left), compared with the overall codon distribution (right).
(F) Classification of reading frames at predicted initiation sites relative to the annotated CDS.
(G) Pattern of initiation and translation on the Swi5 transcript. As in Figure 4A, with the two detected initiation sites shown along with the respective reading frames, one of which produces a conserved amino-terminal extension on the Swi5 protein.
(H) Pattern of initiation and translation on the Ecsit transcript. Four AUG initiation sites are present, two associated with uORFs and two with alternate protein isoforms of Ecsit.

