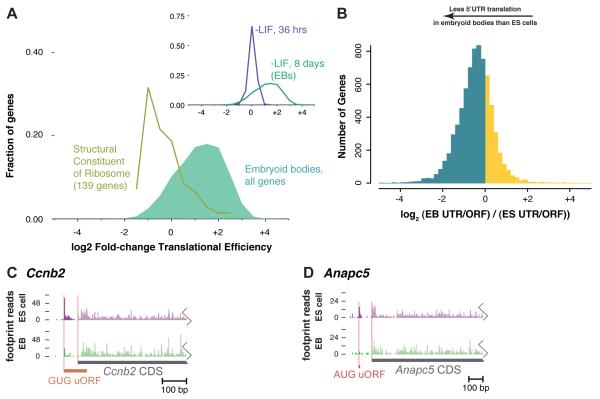
Figure 7.
Changes in Upstream Translation During Differentiation
(A) Translational regulation following LIF withdrawal. The distribution of log2 fold-changes of translational efficiency (ratio of sample-normalized ribosome footprint density to mRNA-seq density) is shown for all genes and for those with the GO annotation “structural constituent of ribosome” (see Table S5D). Inset: distributions for all genes, 36 hours and 8 days after LIF withdrawal (see Tables S5A and S5D).
(B) Changes in relative upstream translation in EBs versus ES cells. The ratio of footprints between the 5′UTR and the ORF was computed for each gene and the distribution of log2 change in the 5′UTR/ORF ratio is plotted, with decreases in EB shown in blue and increases in EB shown in yellow.
(C-D) Patterns of translation on the Ccnb5 (C) and Anapc5 (D) transcripts. Ribosome footprints that map to the 5′UTR are in dark colors and the CDS in faint colors. The average, sample-normalized ribosome footprint density on the CDS is slightly higher in the EB sample than the ES cell sample for both.

