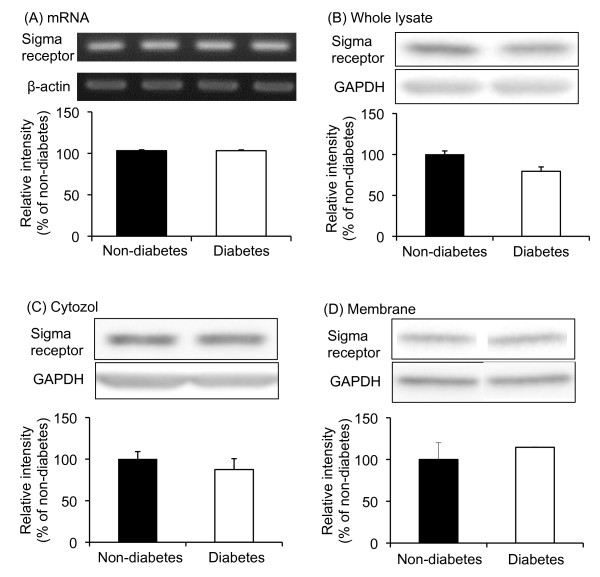
Figure 6.
σ1 Receptor mRNA (A), and protein (B, C, D) expression in the spinal cords of diabetic and non-diabetic mice. Protein expression was evaluated in the whole lysate (B), cytosol fraction (C), and membrane fraction (D). Immunoblots are from an experiment that is of 4 similar experiments. Each column represents the mean ± S.E.M. of 4 separate experiments.

