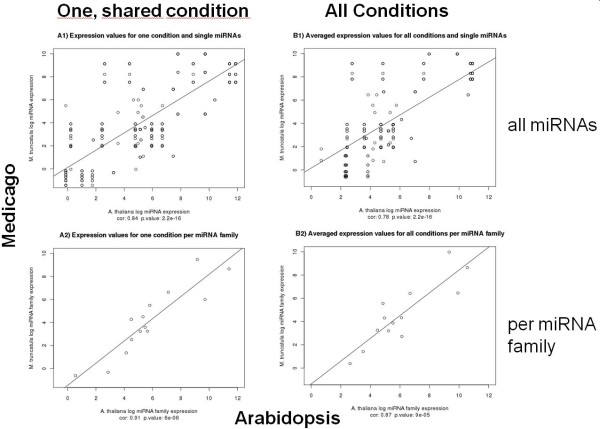
Figure 3.
Comparison of miRNA expression levels in Ath and Mtr based on normalized read counts from Solexa/Illumina sequencing data. Graphs A1 and A2 show the results for the one experimental condition that was directly comparable between Ath and Mtr (Ath: phosphate-starvation, Mtr - non-mycorrhiza state). Graphs B1 and B2 show the averaged expression levels across all conditions available for the respective species. The upper row (A1, B1) display the results for all individual miRNAs, the lower row (A2, B2) shows expression levels averaged over all miRNAs belonging to the same miRNA family. Values refer to log-2 transformed normalized read counts.

