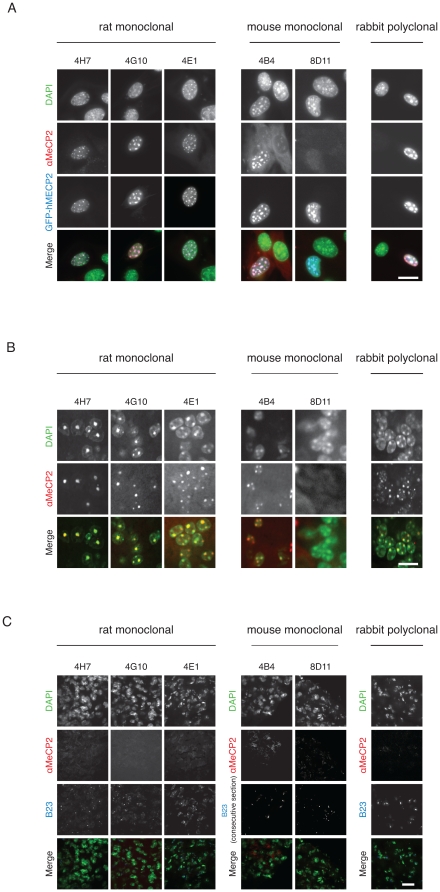
Figure 6. In situ analysis of MeCP2 in cells and tissue.
A) Mouse myoblasts (C2C12 cells) were transiently transfected with GFP-MECP2 (human) and fixed using formaldehyde. MeCP2 was then detected with our monoclonal antibodies (undiluted) and our rabbit polyclonal antibody (1∶500). The first row shows the DNA counterstain (DAPI) of transfected and untransfected cells (green). The row underneath shows the signal obtained by our antibody staining (red). The third row shows the localization of the transfected GFP-MECP2 (blue). The merge contains an overlay of the antibody staining, the fluorescent signal of GFP-MECP2 and the DNA counterstain. Scale bar 20 µm. B) Mouse wild type brain sections (25 µm) were stained using our antibodies. The first row shows the DNA counterstain with DAPI highlighting heterochromatic regions. The central row shows the signal obtained by immunofluorescence with our antibodies. The last row shows an overlay of DAPI and MeCP2. Scale bar 20 µm. C) Mouse MeCP2 hemizygous null brain sections (25 µm) were stained as described above as a negative control. Mouse anti B23 antibody was used as a positive control (consecutive section when testing mouse monoclonal anti MeCP2). Scale bar 40 µm.

