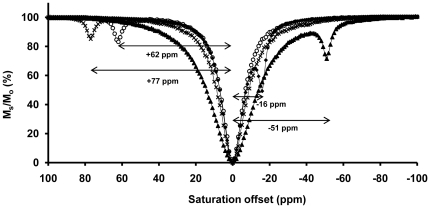
Figure 2. CEST spectra of the four LnDOTA-(gly)4 complexes.
Each complex (20 mM, pH 7.5, 310 K) shows a different amide proton chemical shift with respect to the bulk water (δH2O = 0 ppm). The spectra were collected at 9.4 T using a frequency-selective, presaturation pulse over the frequency range ±100 ppm (B1 = 21.2 µT, 2 s for Tm-, Dy-, Tb-DOTA-(gly)4 − and 4 s for YbDOTA-(gly)4 −).

