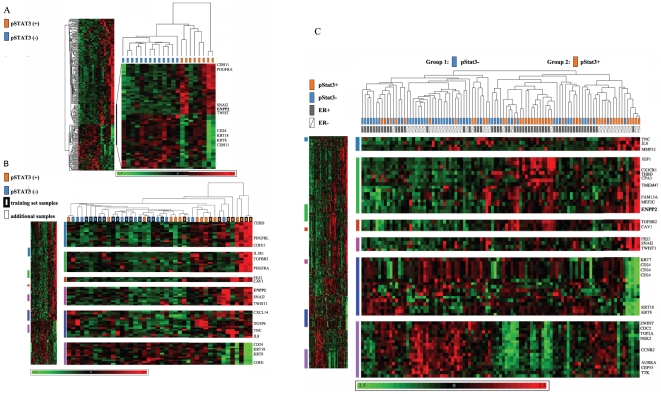
Figure 3. Hierarchical Cluster Analysis by pStat3.
A. Two-way hierarchical clustering was performed with the 21 ER− pStat3 (+/−) samples using the gene expression values limited to the 214 differentially expressed genes. The region of the dendrogram including ENPP2 is enlarged. B. The same analysis as described in A was performed with the 41 ER− samples. Several regions of the dendrogram including ENPP2 were enlarged C. Two-way hierarchical clustering was performed with all (98) of the tumor specimens categorized by pStat3 status (+/−) using the 214 differentially expressed genes. The dendogram represents the relationship among samples, and the length of branches represents 1 minus the pearson correlation coefficient between two samples. Group 1 are primarily pStat3 negative and Group 2 are pStat3 positive. Samples are arranged in columns and genes in rows. Normalized expression levels are pseudocolored red to indicate transcript levels above the median for that gene across samples, and green for expression below the median. Color saturation is proportional to the magnitude of expression. Several clusters of differentially expressed genes including ENPP2 are enlarged. ER and pStat3 status are indicated for each sample (grey versus white, orange versus blue).

