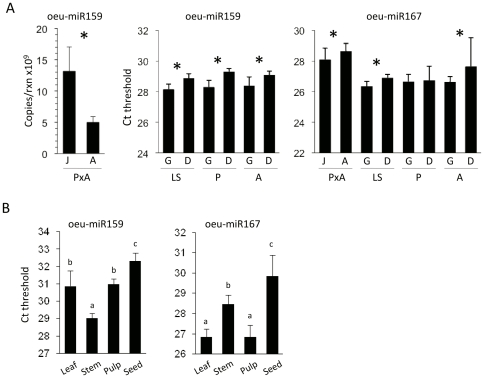
Figure 2. Expression analysis of representative olive miRNAs using quantitative stem-loop RT-PCR.
Expression of miR159 and miR167 was quantified in juvenile (J) and adults (A) shoots as well as growing (G) and dormant (D) buds from different olive genotypes (A) and in different olive tissues (B). miRNA abundance is expressed as the number of copies per reaction (absolute quantification method) or as function of the threshold cycle (Ct) as indicated. Note that the Ct is inversely proportional to the relative abundance of each miRNA. Error bars indicate standard deviation of three different technical repeats of each of two biological replicates. Significant differences at P<0.01 (One Way ANOVA and Duncan test) between samples are indicated with asterisks or with different letters. Olive varieties as follow: (P) ‘Picual’, (A) ‘Arbequina’, (LS) ‘Lechin de Sevilla’, (PxA) ‘Picual’בArbequina’ cross.

