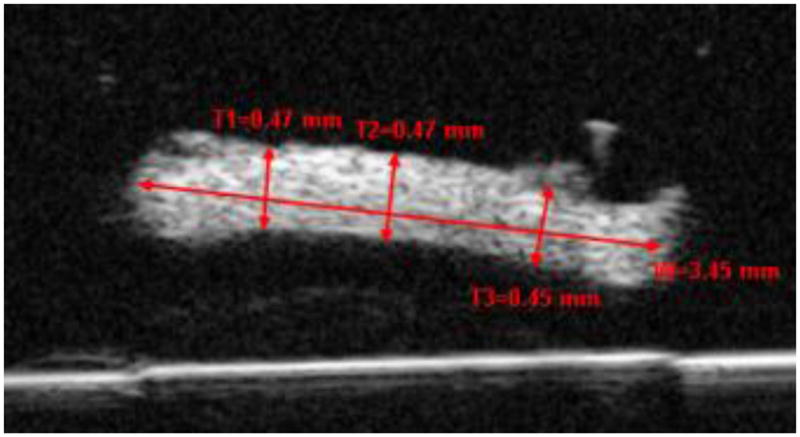
Figure 2.

A high-frequency B-mode ultrasound image showing the cross-section of a scleral strip. Three thickness measurements and one width measurement using the VisualSonics image processing software (recalibrated for a speed of sound = 1640 m/s) are shown. W=Width; T=Thickness.
