Figure 2.
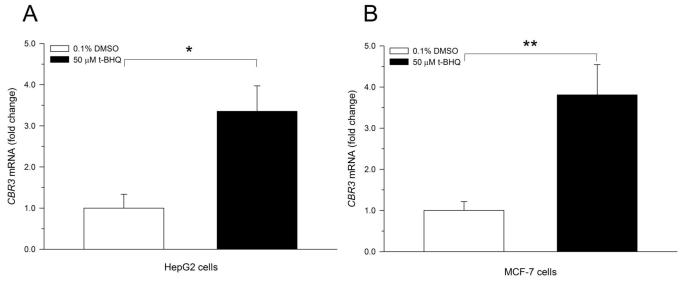
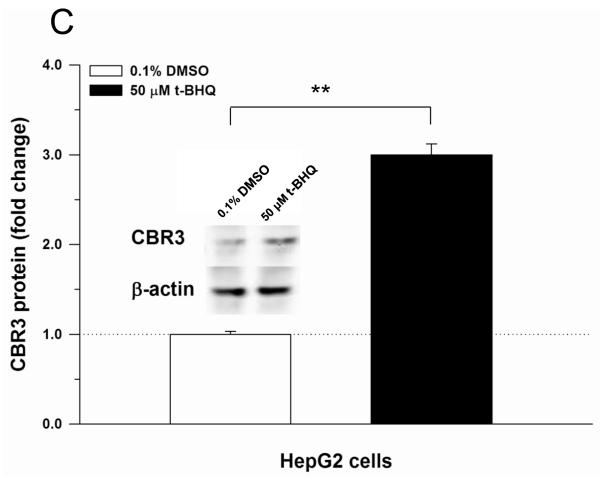
Induction of CBR3 mRNA by the Nrf2 activator t-BHQ in HepG2 (A) and MCF-7 cells (B). Induction of CBR3 protein expression in HepG2 cells by t-BHQ (C). Cells were grown in monolayer cultures to sub-confluence and treated with DMSO (0.1%, v/v) or 50 μM t-BHQ for 18 h. The expression of CBR3 mRNA and CBR3 protein was analyzed by quantitative real-time RT-PCR and immunoblotting as described under Materials and Methods. Each value represents the mean ± S.D. from 3 independent experiments analyzed in triplicates. Asterisks indicate significant differences from CBR3 mRNA (A and B) and CBR3 protein (C) levels from vehicle treated cells (*, p<0.05; **, p<0.01).


