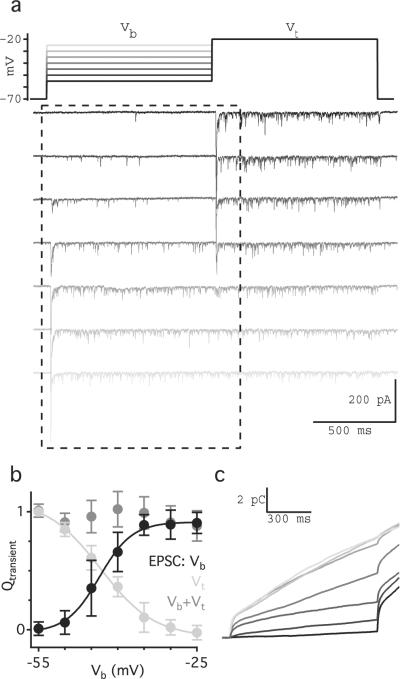
Fig. 3.
RRP continuously varies with VRBC. (a) Individual current recordings show typical AII EPSCs evoked by stepping VRBC to a background potential for 1 s followed by a 1 s test step to −20 mV. (b) Average integrated current (± sd; n = 10 cells) measured over the transient component of the response to Vb (black) and Vt (light gray), plotted against ϕt. The arithmetic sums of the transient responses to Vb and Vt are plotted in dark gray. (c) Integrated current traces corresponding to the current traces shown in panel a during Vb and a portion of Vt.

