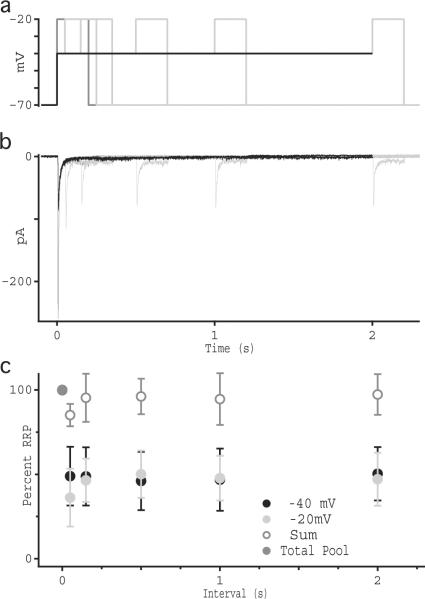
Fig. 4.
RRP occupancy is constant during sustained release. (a) Voltage protocol used to measure RRP occupancy over time. Step from −70 to −20 is shown in dark gray, step to −40 mV is shown in black, and steps to −20 mV from −40 mV at varying intervals are shown in light gray. (b) Individual current recordings from synaptically coupled RBC-AII pairs showing typical AII EPSCs in response to VRBC voltage steps described in panel a. Shades of current traces correspond to colors shown above. (c) Average integrated current (± sd; n = 7 cells) measured over the transient component of the response, plotted as a percentage of charge transfer in response to the −70 to −20 mV step. Open symbols show the arithmetic sum of the transient responses to the −70 to −40 and −40 to −20 mV responses. Deviation from of the −20 mV response during the shortest time interval reflects an over-subtraction of the baseline from the preceding transient response.

