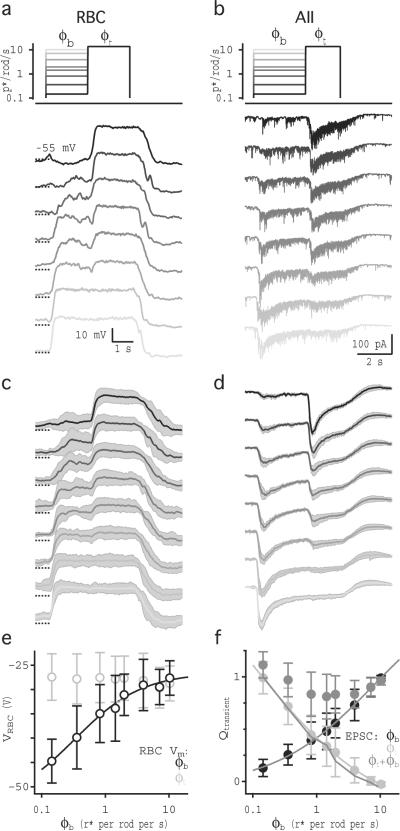
Fig. 5.
RRP occupancy encodes luminance. (a) Perforated-patch current-clamp recordings from a single RBC show voltage responses to steps in ϕ for full-field light stimulation. Schematic shows the light intensity of each step corresponding to the voltage traces shown below. (b) Whole-cell voltage-clamp recordings from a single AII amacrine cell in response to the same light stimulation protocol used in (a). (c) Average (± sd, gray shading) light responses in 5 RBCs. Traces were down sampled to 1kHz resolution before averaging. (d) Average (± sd, gray shading) light-evoked EPSCs in 10 AIIs. Traces were down sampled to 0.1kHz and smoothed with a 12 Hz cutoff Gaussian filter before averaging. (e) Average voltage responses (± sd; n = 5 cells) to ϕb and ϕt plotted against ϕ. Solid black line is the Hill equation fit to VRBC(ϕb). (f) Average integrated current (± sd; n = 10 cells) measured over the transient component of the response to ϕb (black) and ϕt (light gray), plotted against ϕt Solid black and light gray lines represent the Hill equation fits to Qt(ϕb) and Qt(ϕt), respectively. Dark gray symbols indicate the sum (average ± sd; n = 10 cells) of transient responses to ϕb and ϕt. Dark gray line shows the arithmetic difference between VRBC(ϕt) and VRBC(ϕb).

