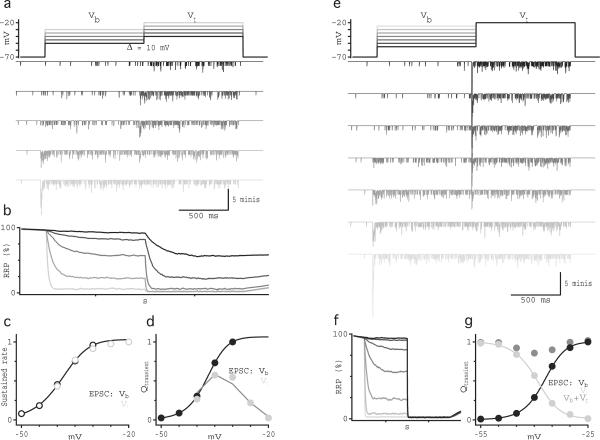
Fig. 6.
Synaptic simulations suggest that a homogeneous RRP is sufficient to encode a measure of contrast and luminance. (a) Schematic of the voltage protocol used in the paired recordings in figure 2. Simulated traces below show the “current” output from the model (see methods) for a single trial with an RRP size of 55 vesicles. (b) As in (a), but with the voltage protocol used in the paired recordings in figure 3. (c) RRP occupancy vs. time for the simulations in (a). (d) The sustained rate of simulated vesicle release measured in (a) over the last 0.5 s of the step to Vb (black) and Vt (gray) vs. VRBC. Solid line shows the Hill equation fit to the simulated data points. (e) Integral of the “current” during the transient component of the responses in (a) to Vb (black) and Vt (light gray). Dark gray line shows the subtraction between the rate(Vt) and rate(Vb). Solid black line shows the Hill equation fit to the measurements of Q(Vb). (f) RRP occupancy vs. time for the simulations in (b). (g) Integral of the “current” during the transient component of the responses in (b) to Vb (black) and Vt (light gray) vs. simulated VRBC. Solid lines shows the Hill equation fit to the measurements for Q(Vb) (black) and Q(Vt) (light gray). Dark gray symbols show the sum of the transient responses to Vb and Vt. The data in panels c–g reflect an average of 40 trials for an RRP size of 55 vesicles.

