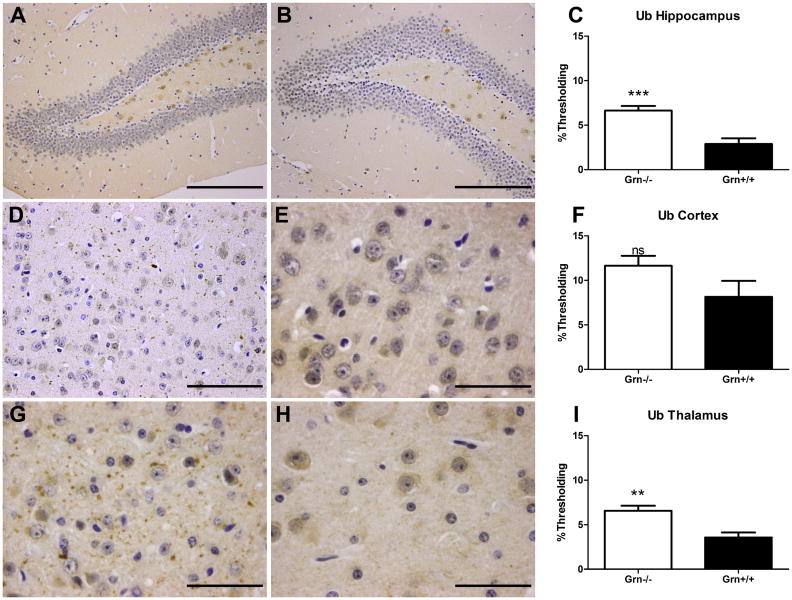
Fig. 7. Increased ubiquitination observed in 24-month old Grn-/- mice.
Grn-/- mice (A, D, G; n=4) have an increased number of ubiquitinated structures, largely in the neuropil, compared to age-matched Grn+/+ mice (B, E, H; n=4) in the (A-C) hippocampus, (D-F) cortex, and (G-I) thalamus. Scale bar 200 μm in (A, B), 100 μm in (D), 50 μm in (E), and 50 μm in (G, H). Percent thresholding shown in C, F, and I (Grn-/- in white, Grn+/+ in black) as mean ± SEM. Statistics denoted as p>0.05, ns; p<0.01, **; and p<0.001, ***.

