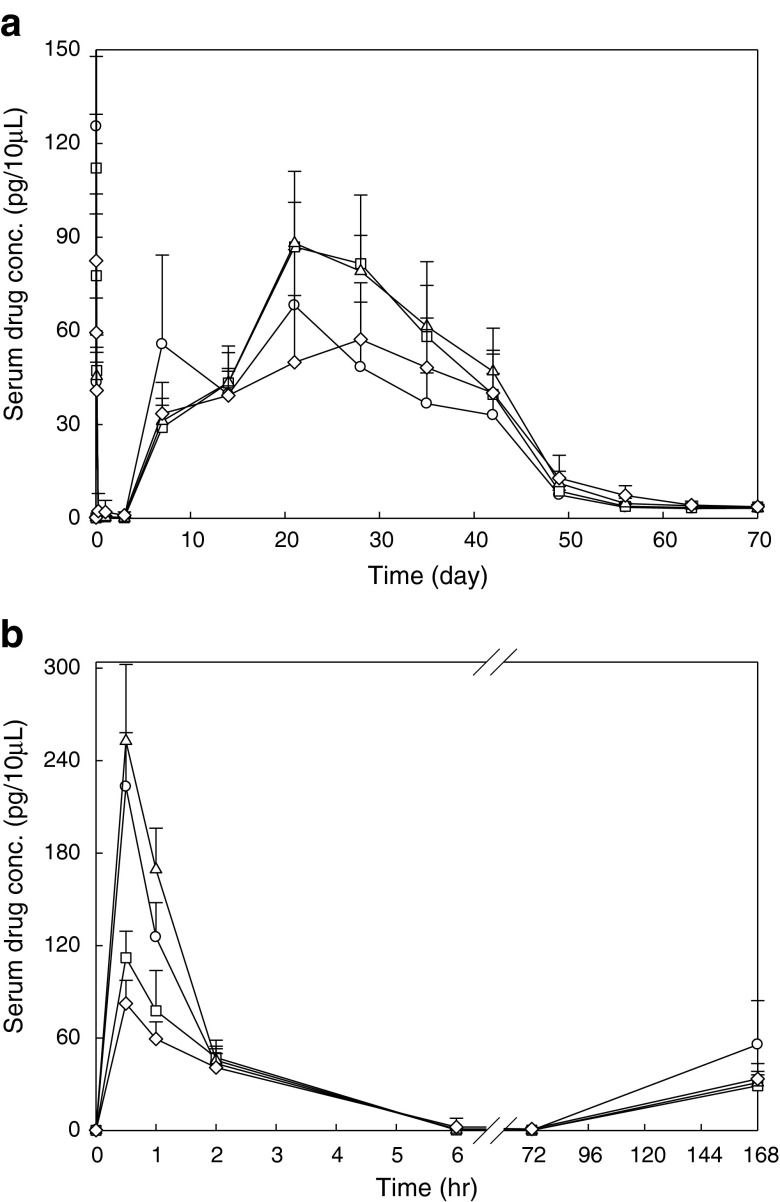
Fig. 1.
a Serum concentration vs. time curves of octreotide after I.M. administrations of three Oakwood formulations and Sandostatin LAR 20 mg at the dose of 3 mg per rat; and b the data collected during the first 6 h after injection. Each point represents mean±S.D. (n = 6 or 7): open circle Oakwood formulation 1; open square Oakwood formulation 2; open upright triangle Oakwood formulation 3; open diamond Sandostatin LAR® 20 mg

