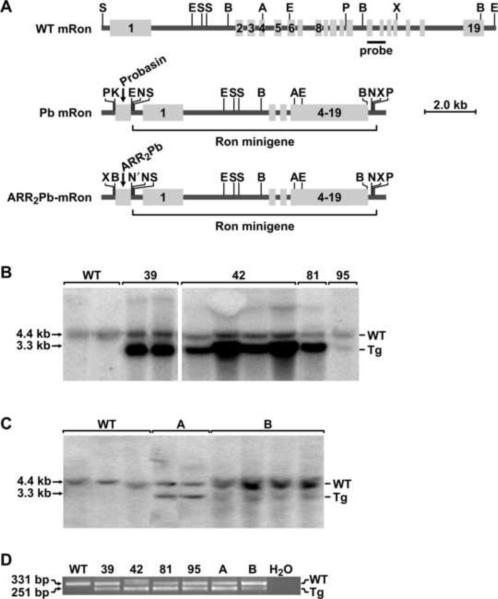
Figure 1. Generation of transgenic mice overexpressing Ron driven by rat probasin promoters.
A, Schematic representation of the Ron expression cassette utilized for the generation of the transgenic mice. The top diagram represents the endogenous (WT) wild type mouse (m) Ron gene. The middle diagram represents the Ron minigene construct driven by the rat probasin promoter (Pb mRon). The bottom diagram depicts the Ron minigene driven by ARR2Pb promoter as described in Materials and Methods. The mRon transgene harbors the first three exons and introns of WT mRon genomic DNA followed by, in the correct reading frame, exons 4 to 19 of WT mRon cDNA. The location of a 706-bp genomic DNA probe utilized for Southern analyses to differentiate transgenic from endogenous WT mRon is noted (probe). Restriction enzyme sites are as follows: A, AgeI; B, BamHI; E, EcoRI; K, Kpn1, N', Nhe1, N, NotI; P, PmeI; S, SpeI; X, XhoI. B and C, Southern analysis of the founder transgenic lines demonstrating the endogenous Ron gene and transgenic construct. Each lane represents an independent sample of genomic DNA. D, PCR analysis of genomic DNA from wild type mice and the transgenic lines depicting the endogenous Ron gene (top band) and the transgenic allele (bottom band).

