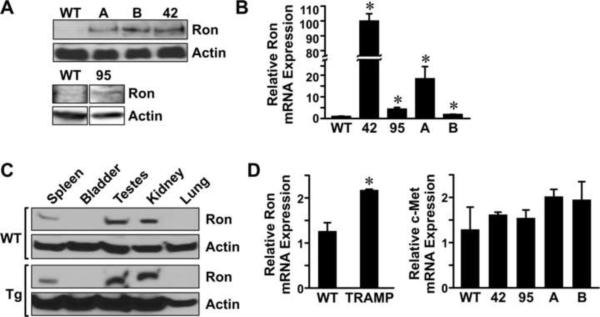
Figure 2. Transgenic Ron expression.
A, Western analysis depicting Ron expression in the prostates of the transgenic lines listed compared to undetectable levels of Ron from WT prostates. Actin serves as a loading control. B, Quantitative Real-Time (qRT)-PCR shows elevated levels of Ron mRNA in the transgenic lines compared to WT controls. C, Ron is endogenously expressed in spleen, testes and kidneys of WT and transgenic mice. Representative data is shown from the 42 line. Actin serves as a loading control. D, (Left panel) qRT- PCR comparing Ron expression in the TRAMP model of prostate cancer to wild type prostates from 30-week-old mice. (Right panel), qRT-PCR was performed for c-Met expression on prostates isolated from WT mice and the transgenic lines relative. Levels of the Ron related receptor, c-Met, are not significantly altered following Ron overexpression. All qRT-PCR data are expressed as mean ± standard error from at least 3 independent samples per groups analyzed in duplicate. *P<0.05 compared to WT.

