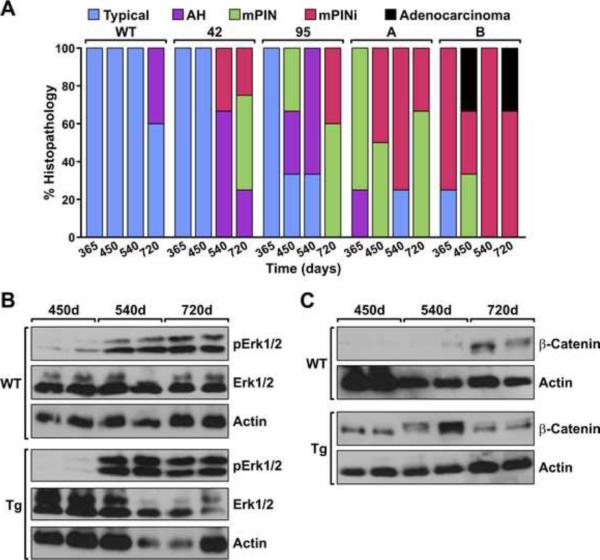
Figure 4. Temporal comparison of pathology and signaling factors in prostates of WT and Ron transgenic mice.
A, The transgenic lines have increases in prostate pathology over time compared to WT prostates. Of note, the Pb derived lines exhibited only typical pathology at 365 days and only progressed to mPINi stages at the latter time points. The ARR2Pb derived lines exhibited the more severe prostate pathology at earlier time points compared to WT prostates and the 42 and 95 lines with the majority of ARR2Pb lines exhibiting mPINi or adenocarcinoma by the end stage time point. (n=3–5 prostates per group/time point). B and C, Prostate lysates isolated from WT and the transgenic lines at the time points noted were evaluated by Western analysis. Increases in the phosphorylation of ERK1/2 (pERK1/2) per total ERK (B) as well as increases in β-catenin expression (C) were observed in the 95 transgenic line. Samples are shown from two separate mice for each time point. Similar data was obtained for all the transgenic lines. Actin serves as a loading control.

