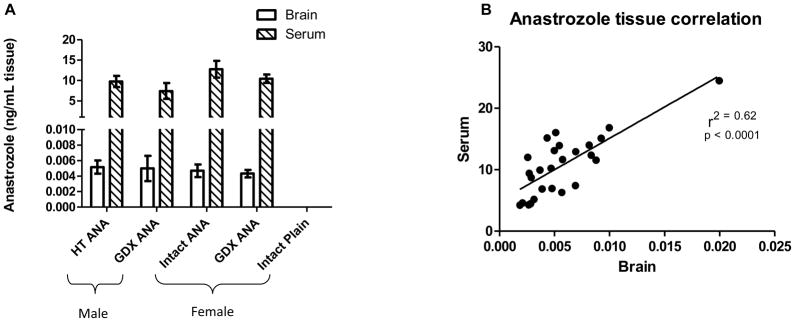
Figure 3.
Bar graphs showing no significant difference between the groups treated with anastrozole (ANA) for either brain (open bars) or serum (hatch bars) using LC-MS (A) in 3xTgAD. Data represents mean and standard error of the mean (SEM). (B) Scatter blot showing a significant correlation between serum and brain levels of anastrozole (ng/mL; p < 0.0001; r2 = 0.62).

