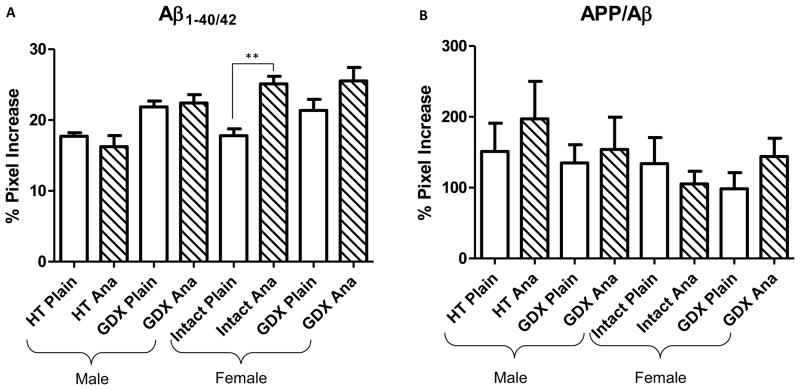
Figure 4.
Histograms showing neuronal optical density (OD) measurements of Aβ1-40/42 (A) and APP/Aβ (B) within the CA1 hippocampal field across treatment groups. (A) Aβ1-40/42 OD measurements were significantly greater in anastrozole (ANA) treated female intact 3xTgAD mice (hatch bars) compared to control. (B) APP/Aβ OD measures were not difference between treatment pairs. Ordinary least squares regression followed by the Holm procedure was used to adjust for multiple comparisons. Data represents predicted mean and standard error of the mean (SEM) (** p value < 0.001; open bars).

