Figure 1.
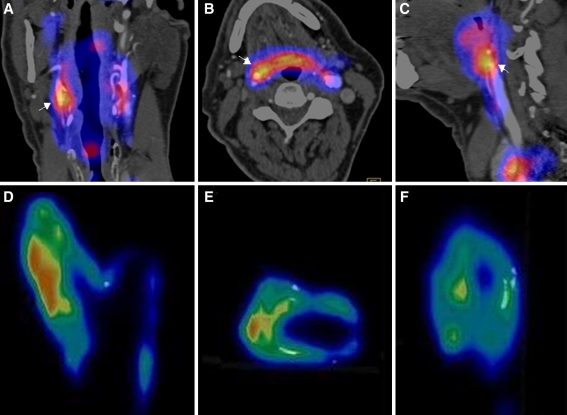
Clinical PET image with coronal (A), transverse (B), and sagittal (C) plane slices of a patient showing FDG uptake in the affected right carotid artery (arrows). Coronal (D), transverse (E), and sagittal plane (F) of corresponding μPET images of the same patient showing also patchy FDG uptake and calcified areas (white depositions)

