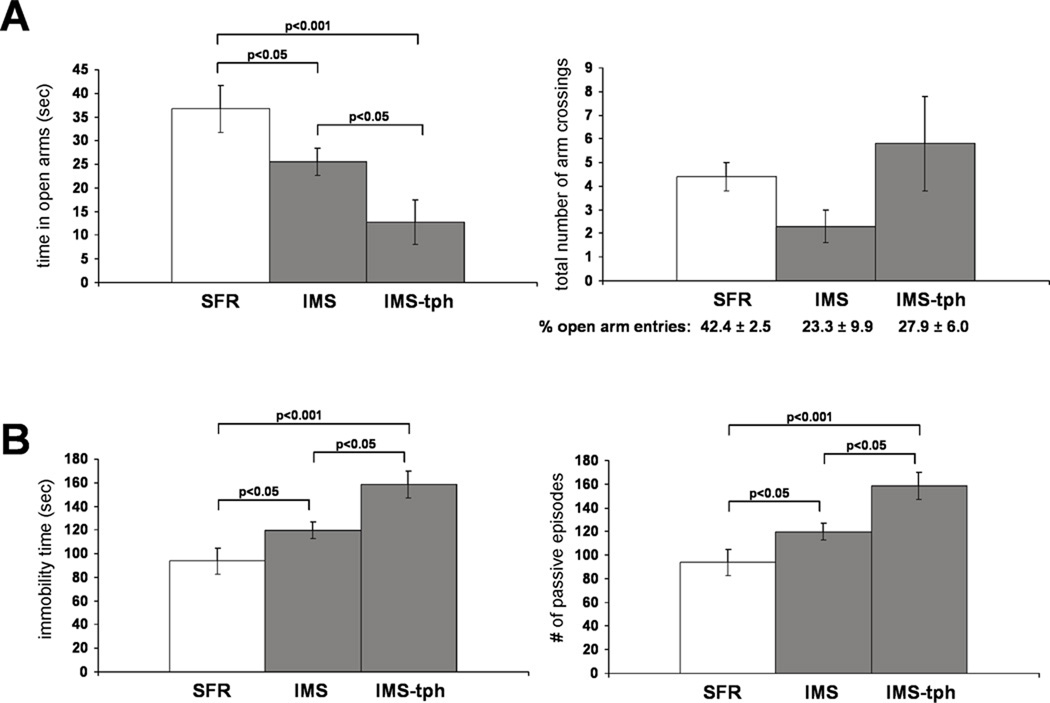
FIGURE 5. The performance of SFR and IMS Balb/c mice and theophylline-treated IMS Balb/c mice in the EPM (A) and FST (B).
Data are mean ± sem of 8 to 10 animals per group and were compared by one-way ANOVA. Statistical differences were resolved post hoc using Tukey-Kramer Multiple Comparisons tests as indicated. For the EPM results shown in A, the total number of open and closed arm entries are illustrated in the graph and the corresponding percentages of open arm entries are listed underneath the graph.

