
Figure 4. Modelled activation of CaN and CaMKII in response to tetanic [Ca2+]i transients.
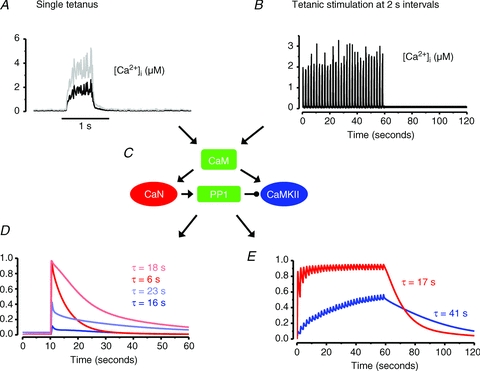
[Ca2+]i from a single 70 Hz, 500 ms tetanus (A) and from a series of 30 such tetani given at 2 s intervals (B; adapted from Fig. 3B). C, outline of the mathematical model into which the [Ca2+]i records were fed. CaM, calmodulin; PP1, protein phosphatase 1. Arrows indicate activation and punctuated arrow inhibition; for detailed description of the mathematical model see Tavi et al. (2003, 2004) and Aydin et al. (2007). D, modelled activation of CaN (red) and CaMKII (blue) induced by the single tetanus in A. τ values represent modelled deactivation time constants. In order to illustrate the effect of higher tetanic [Ca2+]i (e.g. induced by a higher stimulation frequency), A also shows tetanic [Ca2+]i of twice the amplitude (grey line) and the effect on CaN and CaMKII activation is shown in C (lighter colours). E, modelled activation of CaN and CaMKII by the repeated tetanic stimulation in B. Note that CaN is fully activated after a few tetani whereas CaMKII activity increases throughout the stimulation period. After the end of stimulation, the activity of both enzyme decays about three times slower than after a single 70 Hz tetanus.