
Figure 2. Examination of the CRAC currents fails to account for its inability to activate PIP2 depletion.
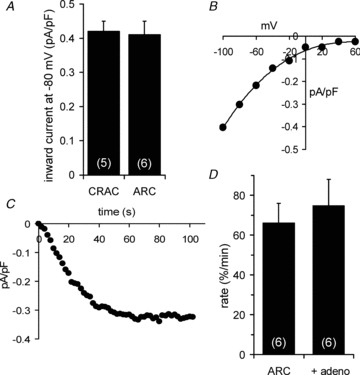
A, comparison of the mean ± SEM current magnitudes of maximally activated CRAC and ARC channel currents, measured at –80 mV. B, representative I–V curve recorded following maximal activation of the CRAC channels with adenophostin-A. C, representative time course of the adenophostin-A activation of CRAC channel currents measured at –80 mV. D, effect of inclusion of adenophostin-A (2 μm) on the rate of decline in Kir2.1 channel currents induced by maximal activation of the ARC channels. Values are means ± SEM with n shown in parentheses.