
Figure 5. PLCδ3 activity modulates agonist-induced oscillation frequency.
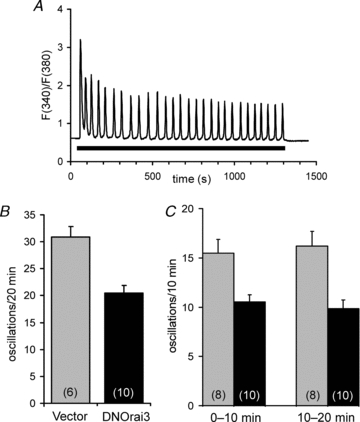
A, representative trace showing a typical oscillatory Ca2+ response to a low concentration of the agonist carbachol (0.5 μm) in a HEK cell stably expressing the m3 muscarinic receptor (m3-HEK cell). The Ca2+ signal is represented as the Fura-2 fluorescence ratio (F340/F380), calculated after background subtraction. The bar represents the period during which carbachol was present. B, oscillation frequency in response to 0.5 μm carbachol in m3-HEK cells expressing either a control vector (grey bars), or the dominant-negative E81Q-Orai3 (black bars). Oscillation frequency was measured as the number of Ca2+ oscillations recorded in cells for the 20 min period following agonist addition. Values are means ± SEM with n shown in parentheses. See Fig. S1 for representative individual traces. C, oscillation frequency in response to 0.5 μm carbachol in m3-HEK cells expressing either the wild-type PLCδ3 (grey bars), or the catalytically impaired H352A mutant PLCδ3 (black bars). Oscillation frequency was measured as the number of Ca2+ oscillations recorded in cells during the first and second 10 min periods after agonist addition, as indicated. Values are mean ± SEM with n shown in parentheses. See Fig. S1 for representative individual traces.