
Figure 5. RMP of HACs.
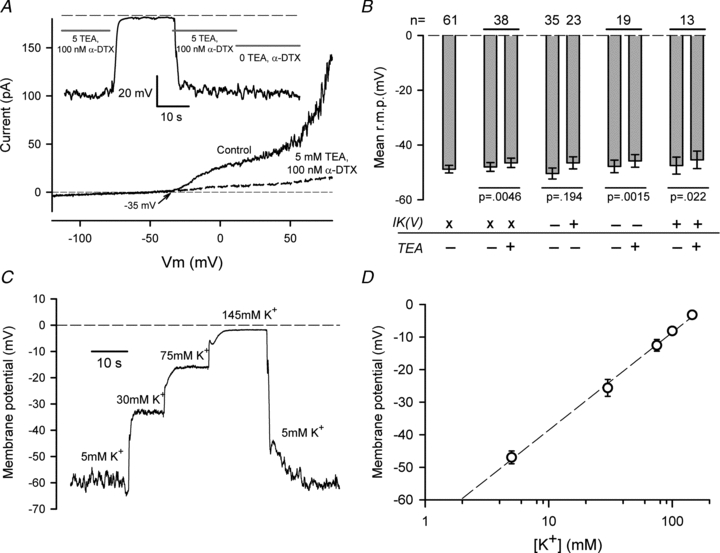
A, effect of 5 mm TEA and 100 nmα-DTX on membrane currents and RMP of a HAC. I–V relations produced by a ramp voltage-clamp protocol are shown before (Control; continuous line) and after exposure to 5 mm TEA/100 nmα-DTX (dashed line). Note complete inhibition of delayed rectifier and BK currents. Inset shows a continuous recording of RMP of the same cell when exposed to 5 mm K+ solution with 5 mm TEA/100 nmα-DTX, or solution without these blockers, as indicated. (Between 15 and 35 s, the cell was exposed to 145 mm K+/5 mm TEA.) Dashed line indicates 0 mV. B, summary of the effect of 5 mm TEA on RMP of HACs that did or did not express detectable delayed rectifier K+ current. n values at top of graph show number of cells in each group. Paired treatments on the same group are indicated by horizontal lines. Statistical significance shown under bars are for paired or unpaired t test, as appropriate. ‘x’ indicates cell groups in which cells with and without delayed rectifier current (IK(V)) were mixed; ‘+’ and ‘–’ indicate groups with and without IK(V), respectively. See text for more detailed explanation. C, a continuous recording of RMP of a HAC in the presence of four concentrations of external K+ (as indicated) is shown. Solution changes were made rapidly with a multi-barrel local superfusion device. D, plot of mean membrane potential vs. external [K+]. Mean values were from 5–16 cells at each [K+]. The dashed line is the best-fit of the equation RMP = A+B× log([K+]), with A = –68.6 mV and B = 30 mV.