
Figure 1. Normalized O2− mapping in the intact perfused heart reveals two distinct ROS peaks in response to acute OS.
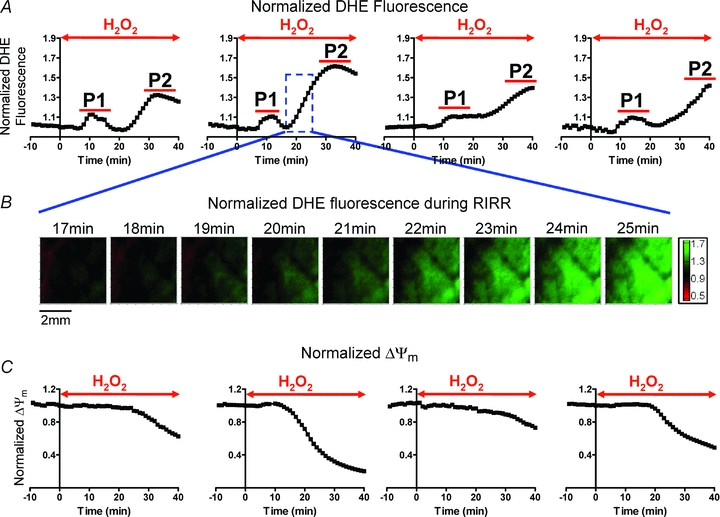
Initial proof-of-concept protocol of OS entailed perfusion of hearts with 200 μm H2O2 for 40 min. This protocol was chosen because it results in sustained ventricular fibrillation (VF) in all hearts. A, average normalized optical O2− levels of individual hearts in response to this protocol of OS. Time of H2O2 perfusion for each heart is indicated by the red arrow. H2O2 perfusion resulted in two distinct O2− peaks (P1 and P2) in all hearts. The maximum amplitude of the delayed peak (P2) was significantly greater than P1. B, contour maps illustrating the dynamic changes in the spatial distribution of O2−. Green represents regions of highest superoxide levels. Representative maps during onset of P2 perfusion demonstrate wave-like propagation of O2− increase, consistent with RIRR. C, normalized ΔΨm levels of 4 Tetra methyl rhodamine methylester (TMRM)-stained hearts in response to this protocol of OS, showing ΔΨm depolarization.