
Figure 4. RIRR-mediated arrhythmias in intact myocardium.
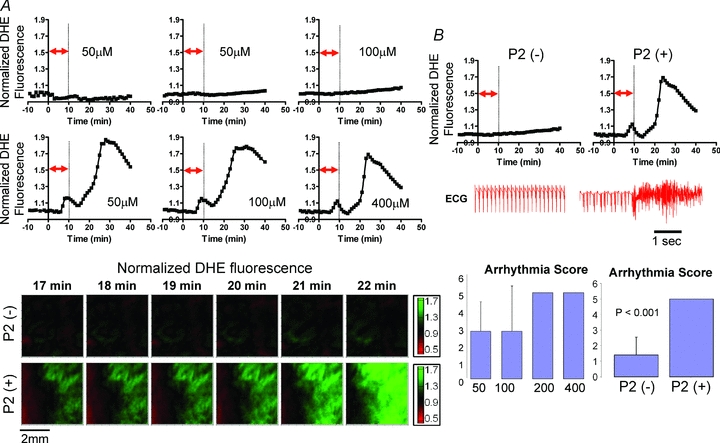
A, representative O2− responses to OS in P2 (–) and P2 (+) hearts. Contour maps of O2− indicating absence (top) and presence (bottom) of increased O2− levels in hearts perfused with different concentrations of H2O2. B, volume-conducted ECG traces recorded from P2 (+) but not P2 (–) hearts exhibit incidence of sustained arrhythmias. Arrhythmia severity was quantified as an arrhythmia score in hearts challenged by increasing concentrations of H2O2 for 10 min (bottom, left). P2 (–) hearts exhibited a significantly lower AS value compared to P2 (+) hearts (bottom, right).