
Figure 5. Role of mPTP in RIRR-mediated arrhythmias in intact myocardium.
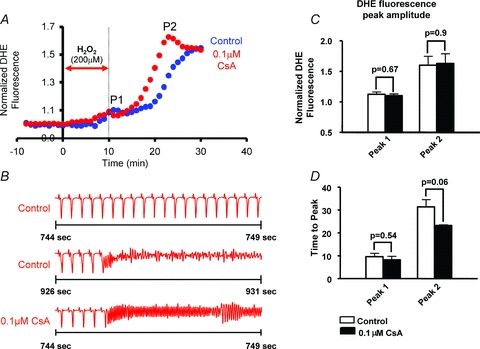
A, average normalized O2− responses of control (blue, n = 4) and 0.1 μm CsA (red, n = 4)-treated hearts to perfusion with 200 μm H2O2 for 10 min. In the treatment group, CsA perfusion was introduced 10 min prior to the H2O2 challenge and maintained throughout the entire protocol. The timing of H2O2 challenge is indicated by the red arrow. B, ECG traces indicating incidence of sustained VT/VF in both control and CsA-treated hearts. Onset of VF occurred earlier in CsA-treated hearts indicating higher sensitivity to OS. C, bar graph comparing maximum O2− amplitudes associated with P1 and P2 peaks in CsA versus control hearts. CsA failed to reduce the amplitude of O2− levels during RIRR. D, bar graphs showing the time at which P1 and P2 occur in CsA-treated versus control hearts. Onset of P2 appears to occur at an earlier time point in CsA-treated hearts, indicating a strong trend (P = 0.06) towards a higher propensity for H2O2-mediated RIRR.