
Figure 1. Composite images of the gastrocnemius muscle produced by joining images from two ultrasound transducers.
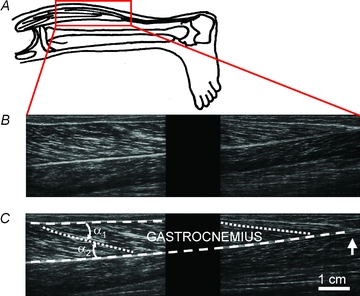
A, position of samples. B, sagittal image of the gastrocnemius. The proximal (knee) end of the muscle is to the left. The field of view of each transducer does not extend to the edge of the transducer so there is a blank ‘gap’ region between the left and right parts of the image. The muscle in these images is at an intermediate length (knee angle 125 deg, ankle angle 89 deg). C, same composite image as in B. Lines show the proximal (upper) and distal (lower) tendinous aponeuroses (dashed lines), and proximal and distal muscle fascicles (dotted lines). Pennation is the average of angles α1 and α2. The vertical arrow indicates the distal muscle–tendon junction. Note that the tendons (aponeuroses) and muscle fascicles follow a smooth course; that is, there is no evidence of buckling.