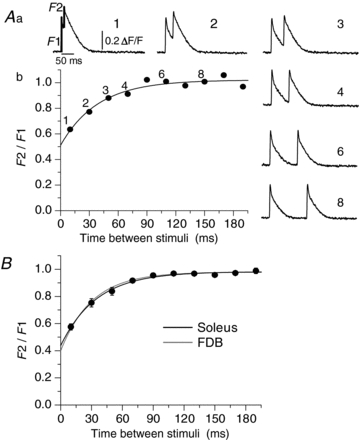
Figure 6. Recovery from inactivation of Ca2+ release in soleus and FDB fibres.

The procedure to study the phenomenon and to construct the curve is shown in A. Aa shows the transients obtained in a soleus fibre which underwent a double-stimulus protocol with 10 ms between them (record labelled 1), a time which is increased by 20 ms for each episode, as seen in the transients labelled 2 to 8. There are 20 s of rest between each episode. Ab, the ratio F2/F1 calculated as shown in Aa. The numbers above the points indicate the record where F2/F1 ratio is plotted. The points were fitted with a function of the form y = y0+A1*[1 – exp(−x/τ1)]. B shows a summary of the inactivation curves of 9 soleus fibres (black trace) to compare with the curve constructed (grey trace) with the values previously reported for 26 FDB fibres by Caputo et al. (2004). Note that the curves almost superimpose.
