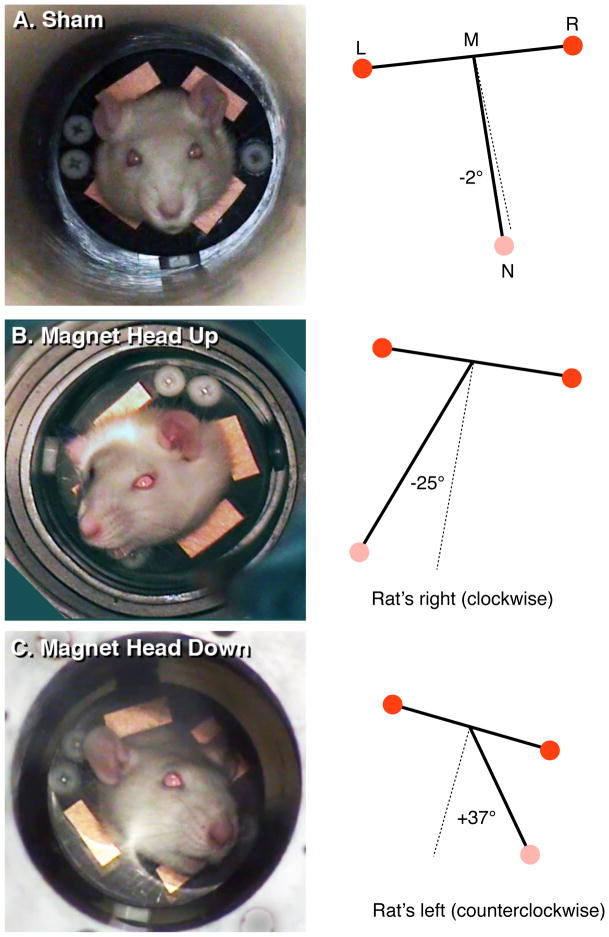
Figure 2.
Examples of rats during (A) sham exposure, (B) 14.1 T magnetic field with head up, and (C) 14.1 T magnetic field with head down. Panels on the left are frames from the video recording. Panels on the right demonstrate the quantification of head tilt calculated as the angle from the nose (N) to the midpoint (M) between the position of the left eye (L) and right eye (R). A deviation from the perpendicular towards the rat’s right was assigned a negative angle (A), while a deviation towards the rat’s left was assigned a positive angle (C).

