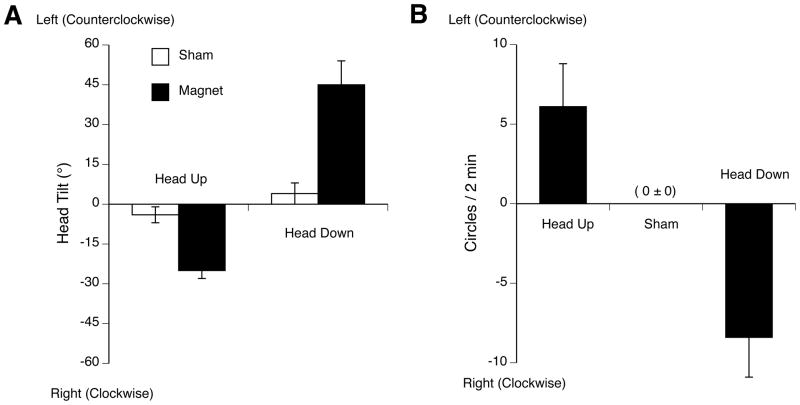
Figure 3.
A. Mean ± s.e.m. head tilt during 30-min sham-exposure (white bars) or exposure to 14.1 T (black bars) in head-up orientation or head-down orientation. The data shown is the average across rats of the individual head tilt averaged at 1-min intervals across the 30 min exposure time for each rat. B. Data replotted from previous report [14] demonstrating locomotor circling immediately after 30-min exposure to 14.1 T while restrained in the head-up or head-down orientation. Note that rats walked in circles after exposure in the direction opposite to head tilt during exposure observed in the present study. * p < 0.05 vs. sham exposure.

