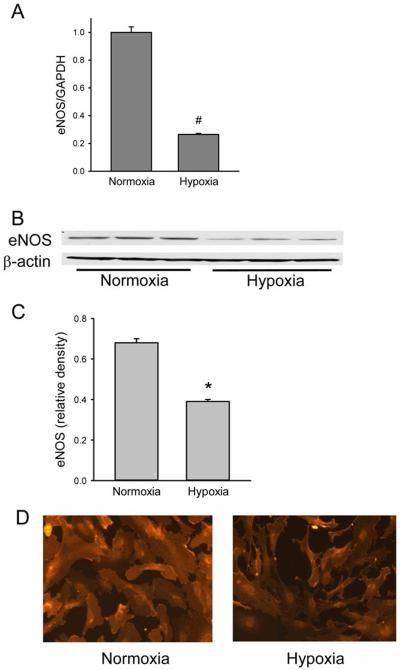
Figure 6.
Hypoxia decreased eNOS expression in hPMVEC. A) Hypoxia resulted in lower eNOS mRNA expression as demonstrated by real-time PCR. The graph shows eNOS mRNA levels normalized to GAPDH mRNA levels, which are plotted relative to normoxic levels. # hypoxia different from normoxia, p<0.001. B) Representative western blots for eNOS from hPMVEC incubated in normoxia or hypoxia for 24 hours. The blots were stripped and reprobed for β-actin. C) Relative density of eNOS bands normalized to β-actin bands. * hypoxia different from normoxia, p<0.01. D) eNOS immunoreactivity was decreased by 24 hours in hypoxia. Representative immunocytochemistry for eNOS from hPMVEC incubated in normoxia (right hand panel) or hypoxia (left hand panel). The representative pictures are from a total of 3 experiments.

