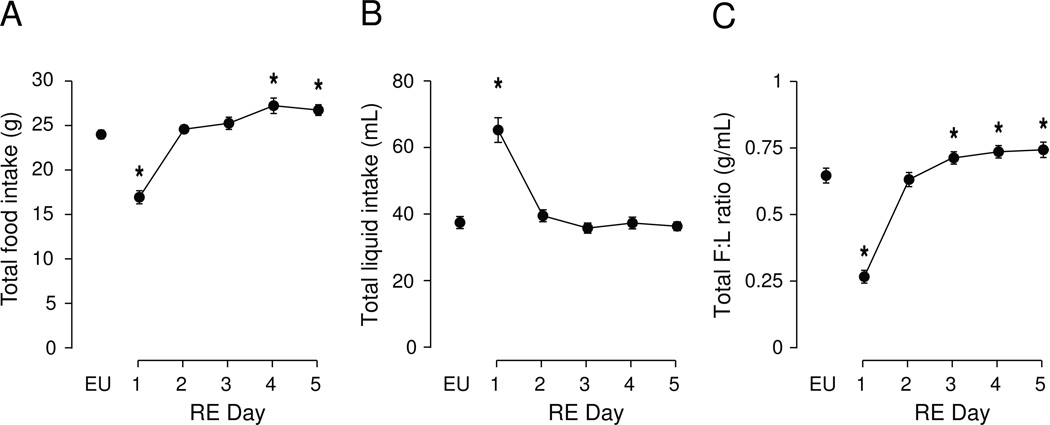
Figure 5. Total daily intake of food, water, and food:water intake ratio during the five days following water-back.
Mean (± SEM) total daily food intake (A), water intake (B), and the food:water intake ratio (C) as measured daily for five days following the return of water to DE rats at 12.00h on Day 1. EU represents baseline values as shown in Table 1. Significant differences across days were determined using one-way ANOVA (see text for results). Symbols denote significant individual differences between EU and subsequent days of RE, where *P<0.05.

