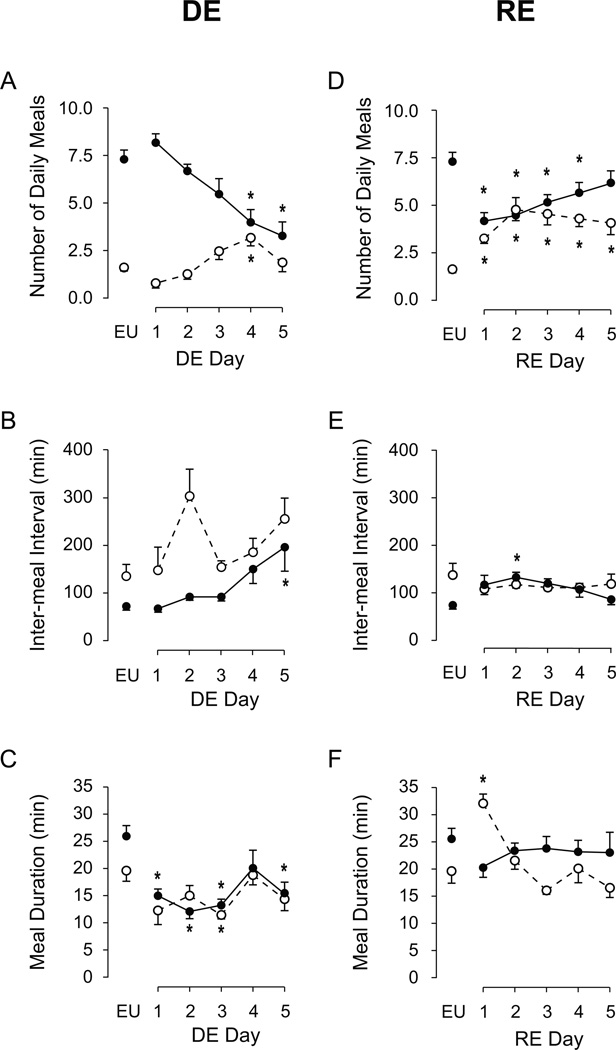
Figure 7. Diurnal variations of composite meal patterns during DE and RE.
Effects of the daily progression of DE (A–C) and RE (D–F) on mean (± SEM) number of meals (A, D), IMI (B, E), and composite meal duration (C, F), during the dark phase (closed circles, solid lines) and light phase (open circles, dashed lines). In each graph, EU represents baseline values as shown in Table 1; Day 1 indicates the first morning of water replacement with HS for DE, or return of water for RE. Significant differences across days, for each phase, were determined using one-way ANOVA (see text for results). Symbols denoting individual differences from EU phase baseline, where *P<0.05.

